Heat Maps: Everything Marketers Need to Know
Heat maps are a game-changer for marketers who want to optimize their website and blog for better engagement and conversions.
By using heat maps to track user behavior, marketers can determine what their visitors like, what they don't like, and what they're ignoring.
Here, we’ll take a closer look at heat maps, how they work, and the different types of maps you can use to optimize your website for more conversions and less friction.
Table of Contents
What is a heat map?
How do heat maps work?
Different Types of Heat Maps [+ What They Can Tell You]
How to Use Heat Maps
What is a heat map?
A heat map is a visual representation of user behavior on your website or blog. It uses color to mark the areas of a webpage that get the most attention from visitors.
Imagine a marketer is re-designing a landing page and wants to position a call-to-action in a high-traffic area. Instead of taking wild guesses on where it should go, she generates a heat map of her website, allowing her to see where visitors are most engaged.
This is what makes heat maps so effective. They allow marketers to visualize, understand, and interpret complex data at a glance.
By identifying patterns in movement and behavior, you can tailor your website (or landing page) to improve user experience, increase conversion rates, and even reduce bounce rates.
How do heat maps work?
Different color schemes can be used in heat maps — from grayscale to rainbow. However, rainbow-schemed maps are often preferred because they enable you to interpret data points more easily.
The “hot” sections of a heat map — typically represented by warmer colors — are most popular with users. Alternatively, the “cold” sections — typically represented by cooler colors — are less popular.
There are two main categories of heat maps:
- Interaction heat maps are used to identify how users interact with a website or blog. They do this by tracking clicks, mouse movements, and scrolling behavior.
- Attention heat maps are more complex, leveraging eye-tracking technology to record the movement of a user' eyes as they scan a webpage.
Next, we'll discuss the different types of heat maps and the benefits of each.
Different Types of Heat Maps [+What They Can Tell You]
1. Scroll maps
Scroll maps show you the percentage of visitors who scroll through each section of your webpage. The hotter the section, the more visitors have viewed it. This data can help determine where to place CTAs or important information on your webpage.
For instance, if your visitors only scroll down 50% of the page, placing a CTA closer to the top — rather than the middle or bottom — would make the most sense.
Remember: When using scroll maps, always look at metrics on different devices, including smartphones and tablets.

2. Click maps
As the name suggests, click maps identify the parts of your page that visitors click on the most. The hotter the section, the more frequently your visitors click on it.
This data can show you if visitors care to click on your CTAs or other buttons that allow them to take a desired action. It can also show you if they’re getting distracted by non-clickable elements or experiencing navigational issues.

3. Hover maps
Hover maps, also known as mouse-tracking heat maps, show you where visitors hover their cursor while reading your webpage. The hotter the area, the longer they hang their cursor over it.
This data can help determine how visitors actually navigate your website, so you can place important elements in a location where they’ll receive the greatest amount of attention possible.
For example, a marketer can track the hover patterns on a checkout page to see where customers experience the most friction.

How to Use Heat Maps
Analyzing the heat map of each type of page on your website would be ideal, but, unfortunately, it isn’t efficient. The most effective way to leverage heat maps is to analyze the pages that influence your website’s conversion rate the most: your home page, landing pages, and high-conversion blog posts.
Home Page
Your homepage is an introduction to your brand. If you constantly monitor which sections visitors are scrolling through and whether they’re hovering over key information and clicking on CTAs, then you’ll know exactly where to place the most important elements of your homepage, reducing your bounce rate and increasing your conversion rate.
Landing Pages
Your landing pages are the last step in turning visitors into leads. If you can analyze your users’ behavior on these pages, then you can implement the optimal landing page design for generating the most amount of leads for your business.
High-Conversion Blog Posts
Your CTAs placement on your blog posts can heavily influence their conversion rate. For instance, at HubSpot, even though our end-of-post banner CTAs are visually engaging, we found out that they only generate a small fraction of our blog leads.
After analyzing our heat maps, we discovered that our anchor text CTAs, which are just hyperlinked blurbs of text located after each blog post’s introduction, actually generated the majority of our blog leads because most visitors saw the CTA at the beginning of the post and not the one at the end.
What is a heatmap?
A heatmap (or heat map) is a graphical representation of data where values are depicted by color.
They are essential in detecting what does or doesn't work on a website or page, and which parts and elements of a page users engage with.
By experimenting with how certain buttons and elements are positioned on your website, heatmaps allow you to evaluate your product’s performance and increase user engagement and retention as you prioritize the jobs to be done that boost customer value.
Heatmaps make it easy to visualize complex data and understand it at a glance:
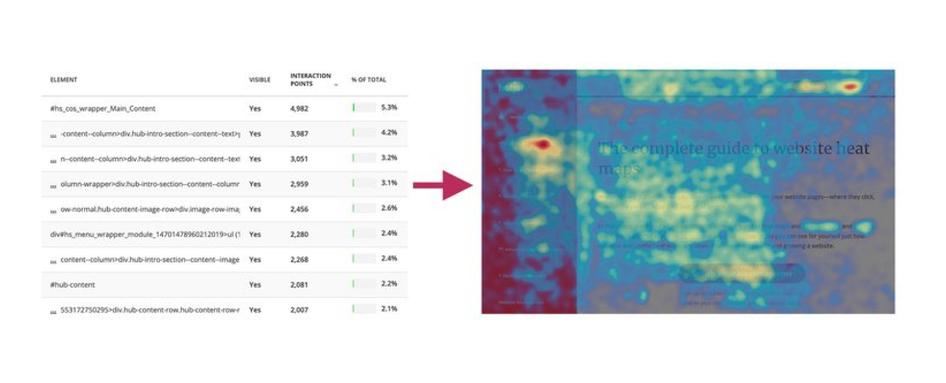
The data on the left is the same as that on the right—but one is much easier to understand
The practice we now call heatmaps is thought to have originated in the 19th century, where manual gray-scale shading was used to depict data patterns in matrices and tables.

An early heat map showing population density in 19th Century Paris districts.
The term heatmap was first trademarked in the early 1990s, when software designer Cormac Kinney created a tool to graphically display real-time financial market information.
Nowadays, heatmaps can still be created by hand, using Excel spreadsheets, or with digital experience insights tools like Hotjar.
What is a website heatmap and how can you use it to improve your product?
Product and website heatmaps visualize the most popular (hot) and unpopular (cold) elements of your content using colors on a scale from red to blue.
But, who uses heatmaps and how do they work?
Heatmaps give product teams, marketers, digital and data analysts, user experience (UX) designers, social media specialists—and anyone who sells anything online—deep insights into people’s behavior on their site, helping them discover why users aren’t adopting their product, using call to action (CTA) buttons, or converting.
By aggregating user behavior, heatmaps facilitate data analysis—combining quantitative and qualitative data—and give a snapshot understanding of how your target audience interacts with an individual website or product page—what they click on, scroll through, or ignore—which helps you identify trends and optimize your product and site to increase user engagement , conversions (CRO) and sales.
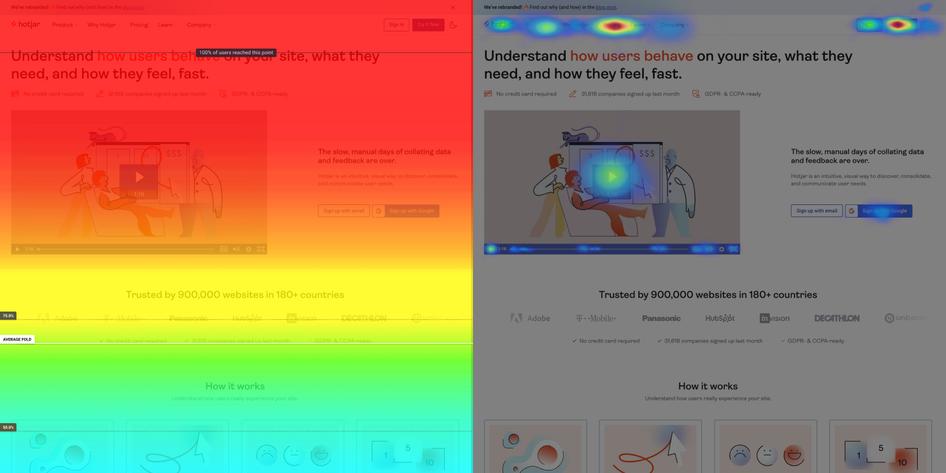
A scroll map (left) and a move map (right) on the hotjar.com homepage
Heat maps also usually display the average fold, which is the portion of the page people see on their screen without scrolling as soon as they land on it.
The benefits of using heat maps on your website
Heatmaps help product managers and website owners understand how people interact with their website pages to find answers to critical business questions and goals such as ‘Why are my users not converting?’ or ‘How do I get more visitors to take action?’ Using heatmaps, you can determine if users are:
- Reaching important content or failing to see it
- Finding and using a page’s main links, buttons, opt-ins, and CTAs
- Getting distracted by non-clickable elements
- Experiencing issues across devices
As a visual tool, heat maps help you make informed, data-based decisions for A/B testing, updating, or (re)designing your website. They're also useful on a wider business scale: heat maps let you show team members and stakeholders what’s happening and get their buy-in more easily when changes are needed—it’s hard to argue with a heat map!

A Hotjar user shares a heatmap with a team member to build a business case to increase buy-in
Hotjar Heatmaps continuously collect and let you filter data and create special heatmaps based on user attributes—like the user's role or title, the date they created their account, whether they're on a trial version of your product, and more—so you can quickly find targeted insights.
For example, product teams might use heatmaps to test how users are interacting with a new feature or prioritize bug fixes, whereas UX and UI designers will use heatmaps to measure the popularity or dislike of a page design, and implement changes that makes it easier for customers to navigate their website.
With Hotjar’s Highlights feature, you can ‘favorite’ and quickly share specific insights of a heatmap with other departments or individuals in your business, achieving successful cross-functional collaboration.
You can also create a ‘collection’ of heatmaps to highlight specific elements you want your business or team to prioritize.
For example, a digital marketer might create a heatmap collection to test a landing page and then decide to move a CTA button above the average fold, reducing churn and increasing sign-ups for their website or product.
We used Hotjar’s insights to narrow down the possible causes of drop-off. It enabled us to focus on and test a few real solutions instead of chasing hypothetical solutions based on guesswork.
What are the different types of heatmaps?
Heatmap is really an umbrella term for different heatmapping tools: scroll maps, click maps, and move maps. Knowing the difference is handy, as each type helps you investigate a slightly different aspect of your website and product performance.

Let's dive in!
1. Scroll maps
Scroll maps show the exact percentage of people who scroll down to any point on the page: the redder the area, the more visitors see it.

An example of a scroll map
2. Click maps
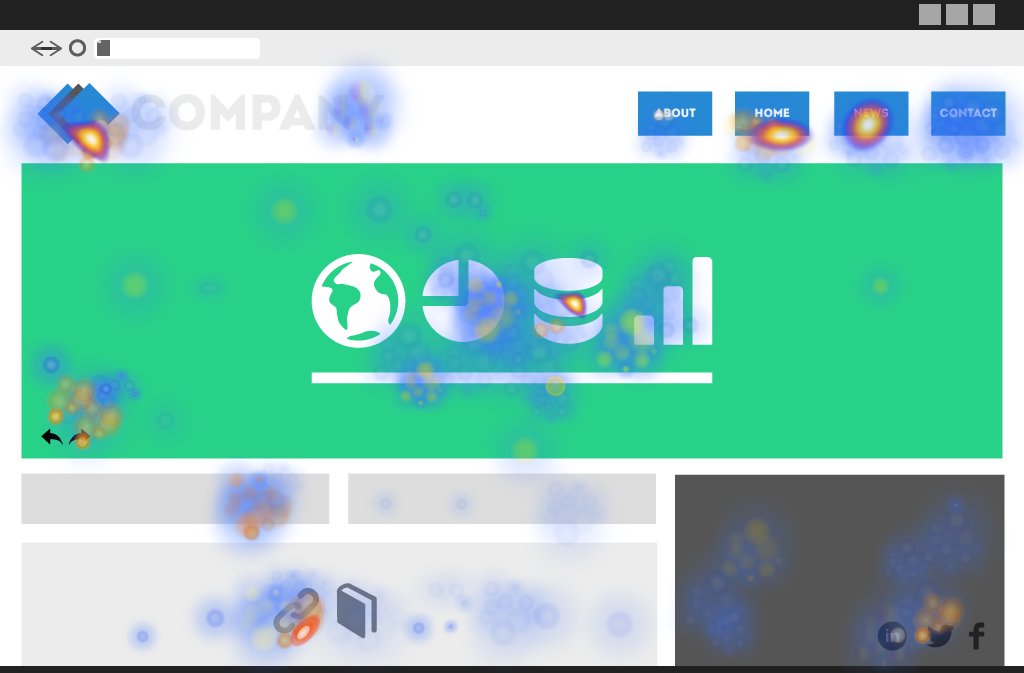
Click maps show you an aggregate of where visitors click their mouse on desktop devices and tap their finger on mobile devices (in this case, they are known as touch heatmaps). The map is color-coded to show the elements that have been clicked and tapped the most (red, orange, yellow).
A click map example
3. Move maps
Move maps track where desktop users move their mouse as they navigate the page. The hot spots in a move map represent where users have moved their cursor on a page, and research suggests a correlation between where people are looking and where their mouse is—meaning that a move map gives you an indication of where people might be looking as they go through your page.

A move map example
4. Engagement zones
Engagement zones combine interaction data sets from click, scroll, and move heatmaps into one simple view.
It’s a powerful data visualization tool that helps you analyze pages in seconds, so you can get a well-rounded view of user engagement with your product.
Engagement zones help you discover new insights, like images that don’t get clicks but wow your users overall
5. Rage click maps
Rage click maps let you pinpoint exactly where users get frustrated on the page. Spot and address those pain points to reduce rage clicks and friction in your key flows to improve UX and boost conversions.

Discover where users rage click on your key pages
6. Desktop, tablet, & mobile heatmaps

A desktop (left) and mobile (right) click map
Desktop, tablet, and mobile heat maps help you compare the performance of your website on different devices. For example, content that is prominent on a desktop page might sit much further below the fold on a phone—and you need to see if interaction differs, and how.
Ready to create a heatmap and improve your website experience?
Heatmaps are easy to create and understand, and they let you discover actionable insights that help you improve the user journey and your product pages to increase retention and sign-ups on your website!
What is heatmap analysis: how to analyze a heatmap
The practice of heatmaps originates back to the early 1900s, when manual gray-scale shading was used to depict data patterns. Now they're a time-tested, effective product experience (PX) insights tool that help you visualize people’s behavior on your site, so you can learn how to make changes that improve the user experience and drive growth.
What is heat map analysis?
Heat map analysis is the process of reviewing and analyzing heat map data to gather insights about user interaction and behavior as they engage with your website or product. This data analysis can lead to improved site designs with lower bounce rates, reduced churn, fewer drop-offs, more pageviews, and better conversion rates. These results can be even more effective by running usability tests (like A/B testing).
A 5-question checklist for successful heat map analysis (and a very handy bonus tip)
There are at least 5 questions you can answer through heat map analysis:
- Are users seeing important content?
- Are users clicking on key page elements (links, buttons, and CTAs)?
- Are users confused by non-clickable elements?
- Are users getting distracted by unnecessary content?
- Are users experiencing issues across devices?
1. Are users seeing important content?
To understand if people are actually seeing significant content elements or sections on your product page, look at a scroll map—i.e. a heat map that shows you how far down the page people scroll.
Follow these three steps to determine if your content is actually selling your product and getting the point across:
1️⃣ Edit content above and below your website’s average fold
Start by reviewing the position of your website’s average fold, which is the portion of the page people see on their screen without scrolling as soon as they land on your site:
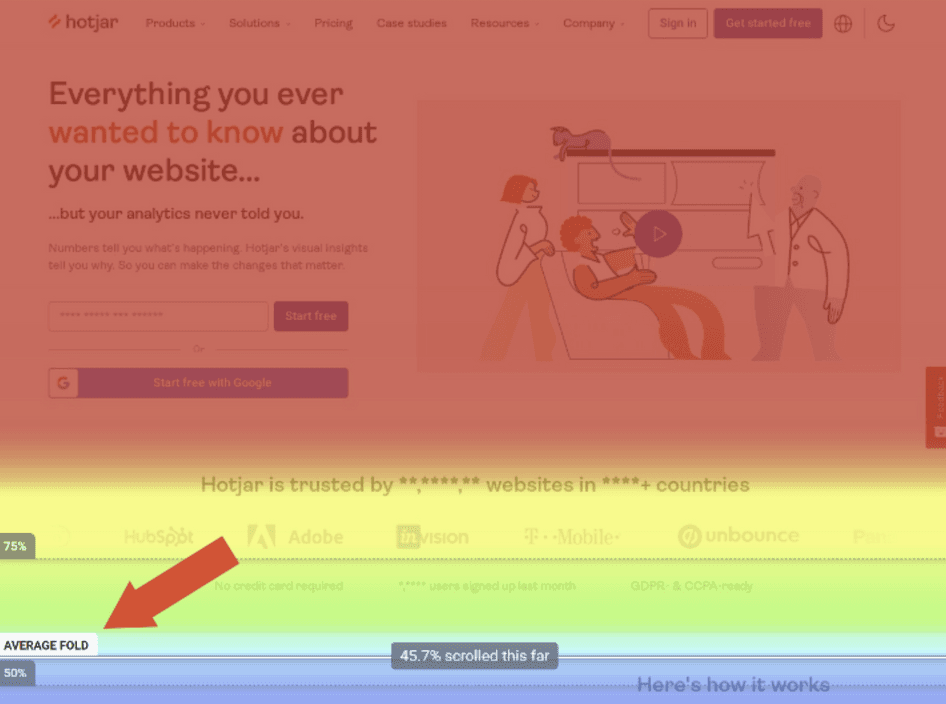
The average fold on a Hotjar scroll heatmap
Knowing where the average fold lies helps you confirm whether people are accessing the most important information on a page—like product offerings, campaign announcements, and more.
For example, you might have very persuasive, viral content that sits a little below the fold, which means people will only see it if the page has managed to capture and hold their attention for long enough that they are willing to scroll down.
💡Note: the fold line is automatically calculated and displayed for desktop and mobile devices when you use a Hotjar scroll map.
2️⃣ Evaluate how visitors interact with page elements

Continue the analysis by reviewing the entire scroll map and looking at the percentage of visitors who make it (or don’t) to specific page points; this data can be particularly useful on long pages, such as a landing page that has a lot of information you want customers to see.
3️⃣ Investigate why users drop off your page
Look out for sharp changes in color on your scroll heatmap. This indicates a significant percentage of people who stopped scrolling—they might be thinking they have reached the end of the page and can’t figure out, from context, that there is more content below.
Scroll maps give you enough data to determine whether key information is getting ignored by the majority of your users and needs moving to a more visible place on the webpage.
2. Are users clicking on key page elements (links, buttons, and CTAs)?
While a scroll map helps you understand if people are seeing specific content elements, a click map quickly confirms if users are clicking on them or not:

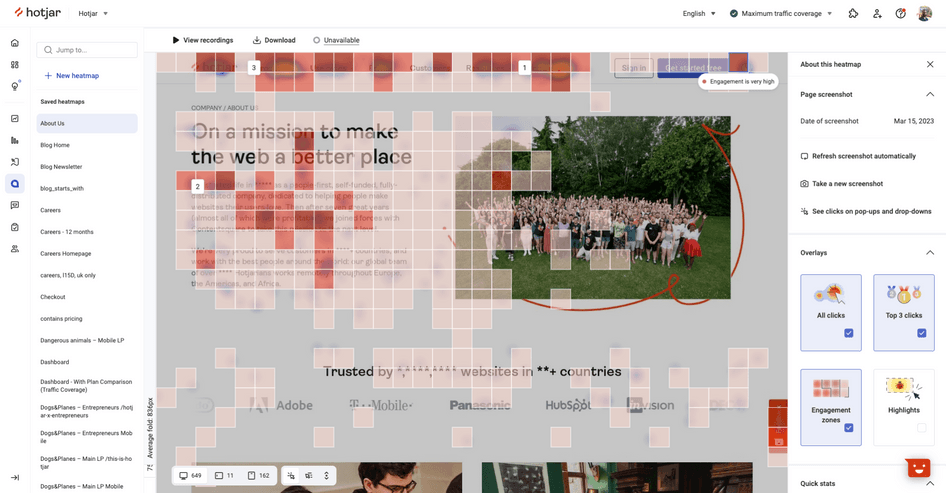
A Hotjar click heatmap example
Your website exists so people can fulfill a goal—they want to find information, sign up for a service, or buy a product. When reviewing a click map, look at elements like calls to action (CTAs), buttons, and links that are there to help visitors fulfill their goal. Are these elements being clicked on—or, in the case of a mobile heat map, tapped? How much interaction are they receiving? Are users ignoring a product feature you want to popularize?
Use this product experience insight to make quick-win design changes or justify the need for more in-depth user research. If and when you end up changing the product page, referring back to the click map will help you compare behaviors and understand if your new design is successful.
Heatmaps helped me identify where users spend most of their time and assess if they should be spending time there or not.
Piriya Kantong
Senior Online Marketing Analyst, Gogoprint
3. Are people confused by non-clickable elements?
Non-clickable elements that look like they might be clickable can cause confusion and frustration for users who waste their clicks while expecting to be taken elsewhere.

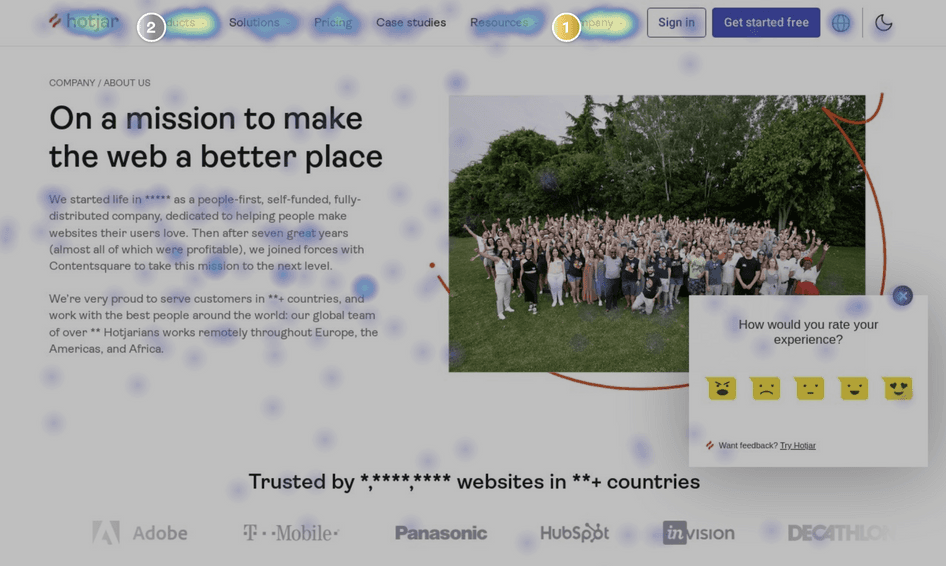
This Hotjar click heatmap shows user confusion in action on the mobile version of our old homepage
In the example above, it seems like somebody tapped on one of the testimonial logos, probably expecting some interaction to take place. Keep this scenario in mind as you review your click maps and look for non-clickable elements like images, titles, or graphical shapes that show evidence of rage click and tap activity.
If you see this type of user behavior, you might need help from your tech or devs department, or a freelance software developer or web designer who can make a few visual changes to differentiate your clickable and non-clickable elements, and add links where previously there were none.
4. Are visitors getting distracted by unnecessary content?
When multiple web page elements compete for people’s attention, they can cause visitors to lose focus on the most important action(s) they need to take.
Analyze move heatmaps to observe whether cursor activity is spread all over the page instead of being focused on key messages and call-to-action buttons and links. Also, check if there are areas of product pages that receive no or low interaction: you may need to redistribute your content or remove/replace content that is taking up valuable space on the page.
With Hotjar’s Highlights feature, you can create a ‘collection’ of heatmaps, emphasize a particular heatmap snippet, and easily share it with teammates or colleagues, executives, and stakeholders, allowing you to build a strong business case and generate stakeholder buy-in for making changes to your product or website pages.
5. Are people experiencing issues across multiple devices?
Your website or product page can look quite different for desktop and mobile users. Important content that is immediately visible on a desktop could end up well below the fold on a cell phone, where fewer users see it. Or the opposite could be true: your pages could look very compact and well-structured on a mobile device, but sparse and poorly organized on very large screens.

Comparing heatmaps of desktop and mobile versions of the same page
Make web traffic comparisons of the same page on Hotjar’s mobile and desktop scroll maps to see if people are consuming more/less content depending on the device they're on. Pair scroll maps with click maps to see if clicking behavior changes and people interact more/less/differently on desktop versus mobile.
If you spot any glaring differences, the next step is to make UX or UI improvements—from applying quick-win changes to completely restructuring and redesigning your page(s) for maximum optimization.
Bonus tip: use Engagement zones to combine data from click, scroll, and move maps into a single view

An example of a heatmap with the Engagement zones overlay
Analyzing the data from individual heatmap types takes time and requires you to switch between each of them (in addition to switching between desktop and mobile views).
That’s where Hotjar ‘Engagement zones’ come in:
In Hotjar, enable the overlay in the panel on the right side of the heatmap, and a grid will appear on top of it. This view aggregates the data from all three heatmap types (scroll, click, and move) so you can analyze which elements of the page users engage with… and those they neglect.
Engagement zones make the process of analyzing heatmaps much faster and easier, so you can spend more time on what actually matters: improving the layout, content, and usability of your website pages.
How to read heatmaps
What are heatmaps and what information do they provide?
Simply put, heatmaps measure visitor usage habits on your website. The first heatmaps you review will look similar to ink blot paintings, but those colors hold valuable data.
Warm colors, like red, orange, and yellow, illustrate the areas of a web page that are drawing the highest user interaction and traffic. Meanwhile, cool colors, like green and blue, mark areas where traffic is less.
Understanding the different heatmaps
You may already employ conventional click and scroll maps to deliver data, but you can employ click and scroll heatmaps as well.
Click heatmaps prioritize areas of your web page based on user traffic from blue (coldest) to red (the warmest). Meanwhile scroll heatmaps provide a similar color radiant breakdown along the side of your webpage which you can use to determine how far down the page users are scrolling.

The third and final heatmap is the segmentation map. Segmentation heatmaps allow you to segment your users to compare behavior patterns on page. For instance, you may want to compare your social media users against your organic visitors or measure traffic coming to your site from the United States as opposed to another country.
Common errors to avoid when reading heatmaps
Warm colors good cool colors bad right? Actually, it’s not that simple and there are a few common errors many marketers make when reading their heat maps.
First of all, be mindful of your mobile vs. desktop traffic. This is important because elements of your web page may not appear in the same way on both versions of the web page. Fail to take this into account and you could be misinterpreting your data.
A second common error digital marketers make with segmentation maps is choosing the wrong segmentation categories. Perhaps your most important findings lie in comparing new versus returning visitors or you have failed to filter out visitors coming from your company’s own ID. Effectively segmenting your heat maps ahead of time removes these pollutants before they can foul up your data.
Lastly, be mindful of the time frame you allot for your analysis. Your chosen timeframe should be long enough to capture an effective amount of data – an overly short timeframe could cause the data to skew unfairly. You should also make sure your chosen timeframe includes periods before and after the change so you can monitor the effects.
How reading and interpreting heatmaps correctly can help your organizational processes
Alright, we’ve covered the different types of heatmaps and how to read them. Now let’s look at the ways in which the data you glean from your heatmaps can benefit your organization. It’s a lengthy list.
Heat map data can help you:
- Make data-driven website optimization decisions.
- Optimize your page templates for your targeted user segments
- Review the order of information on your landing pages. Is the key information up front? Scroll maps can tell you whether your site visitors are staying with your page throughout the most important information. If they aren’t, you may need to rework the page to get those vital portions higher up.
- Investigate your CTAs. Are they being used as you intended or are users clicking somewhere else? Are certain design elements distracting from your CTAs?
- Determine if your targeted segment has the intended behavior on your web pages. Using your segmentation maps, you’ll be able to determine if your web pages are drawing the desired audience and actions you intended.
- Test your navigation to improve user journeys. Are users following the path you’ve outlined? Your click maps can show you and help guide future changes.
- Review the placements of your internal links to ensure the most important links are drawing the attention they deserve.
- Optimize your conversion rates on your forms, shopping carts and other metrics by identifying and removing roadblocks
How does a heatmap work?
How a heatmap is created depends on the type. There are multiple types, but they can generally be bucketed into two categories: interaction and attention heatmaps.
Interaction heatmaps measure different types of engagements and use tracking codes to record interactions between a user and a website, like clicks, scrolls, mouse movements, and more.
Attention heatmaps are more complex, and monitor how users look at your website content by monitoring or predicting their eye movements.
Types of website heatmaps
There are many different types of heatmaps that offer different insights. It's usually best practice to combine multiple types of heatmaps to get the truest picture of user behavior.
Click maps
Click maps are one of the most popular types of website heatmaps, and show you where users clicked on your page, offering insights into how people use your website or a page of your website. With click maps, you can see which elements on your site are most or least clicked, which can reveal where there are navigational issues.
Click maps can also help you improve website ROI by placing and monitoring effective CTA buttons; helping you identify and remove areas that are causing user friction and increasing bounce rates; showing which areas of your site are most popular; and monitoring conversion rates for new and returning visitors.
There are a few things to watch out for when using click maps, though. Improper analysis can occur from accidental multiple login usage, frustrated clicks that can skew data analysis, and miscellaneous issues caused by browser/device incompatibilities, among other shortcomings.

A typical click map in FullStory
Like with any heatmap, visitor click maps need to be paired with other data—data points from product analytics tools, user analytics, Google Analytics, UX surveys, or elsewhere—to get a full picture of why users are behaving the way they are.
Scroll maps
In the same way that click maps represent where users click, scroll maps are a visual representation of visitors’ scrolling behavior on a web page. Scroll maps tell you:
- How many visitors scrolled through a page to the bottom
- How many visitors scrolled through a page but stopped short of the bottom
- How many visitors abandoned a page
- What percentage of users scrolled to certain depths on a web page (for example, 34% of visitors scrolled 50% of the way down a page, 13% of visitors scrolled all the way to the bottom, etc.)
A typical scroll map in FullStory
Understanding how far the average visitor scrolls before navigating away can help you determine the ideal length of web pages. It can also help you decide where to put content on a page.
If, for example, you find that only 25% of visitors scroll below the fold (below where your screen cuts off the rest of the page) on a page, you know that you need to put the most important content at the very top of the page.
Scroll maps can also help you understand if your web page has a false floor (or false bottom), where visitors believe they’ve reached the bottom of a page but actually have not.
When using scroll maps, always look at metrics for both desktop, tablet, and mobile devices.
All in all, using and analyzing scroll maps can show if important content is being ignored and help you understand how a page should be redesigned to maximize its impact.
Mouse-tracking heatmaps
Rather than tracking mouse clicks, mouse-tracking maps track general mouse movement.
They help spot frustrated users by showing where people are hovering, hesitating, or thrashing their cursor on a web page.
Research shows an association between where users are looking and where their mouse cursor is, which is what makes mouse-tracking heat maps informative.
Mouse-tracking also helps you identify hover patterns that show areas of visitor friction or frustration, optimize complex web pages with dynamic elements, and estimate the relevance of search results by the volume of clicks.
Though there’s a relationship between where users look and their cursor location, the two are not identical, and can sometimes lead to faulty insights.
Eye-tracking website heatmaps
Eye-tracking uses a sensor technology that tracks the movements of users’ eyes when they are using a web page. This type of technology can monitor eye movement, blinking, and pupil dilation to analyze where on a page a user’s attention is focused.
This type of data gives you insights into how well a web page’s design is working to help you create a more user-friendly layout. Eye-tracking heat maps can reveal information about a visitor’s gaze pattern, which enables you to put a web page’s most important elements in the most-looked at locations on the page.
Eye-tracking maps typically provide extremely accurate data by showing exactly what users are looking at on your web page. They can be validated through comparison with mouse-tracking data.
However, eye-tracking tools are expensive, usually resulting in data based on a small user sample. Additionally, some users are aware and wary of eye tracking, and use camera covers to avoid being surveyed.
Error click heatmaps
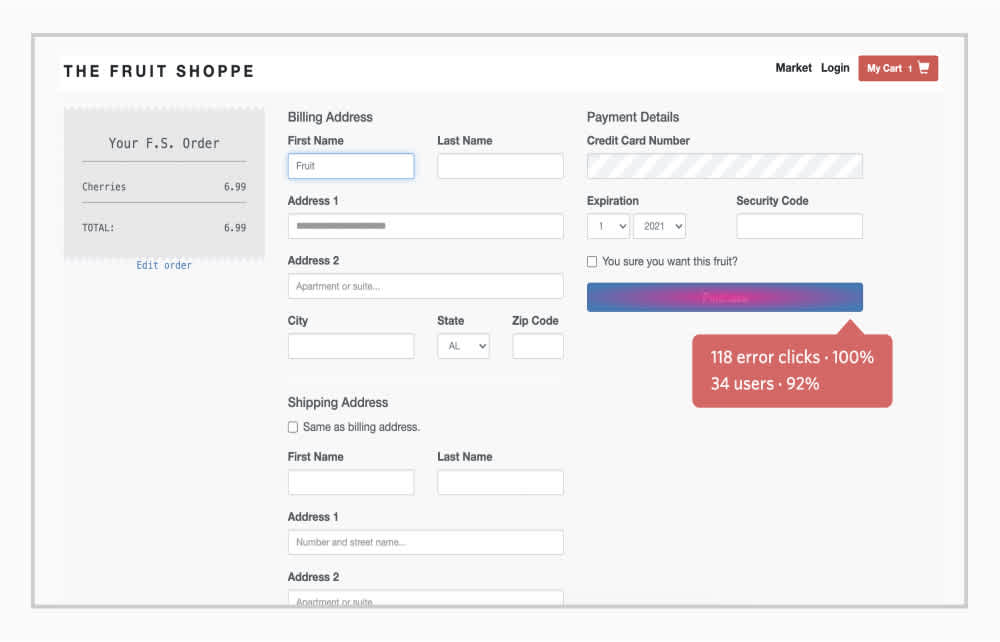
An error click map
Error clicks occur when a user clicks on an element of a web page that triggers some sort of error, like a client-side JavaScript error or a console error.
Though the user may or may not realize they’ve triggered an error, you can use error clicks to specifically investigate console errors or uncaught exceptions. Then, you can use your Digital Experience Intelligence tool to view all sessions that contain the same error and determine how to resolve the issue.
Encountering errors or site glitches can be highly frustrating for your users. Error-click maps let you quickly uncover and fix bugs—drastically enhancing user experience.
Rage Click™ heatmaps
Rage Clicks are used to identify areas of friction or frustration by showing areas where users rapidly click (or tap) an element on your site. Rage Clicks might occur when users mistake a static element for a button and expect something to happen, or when a button isn’t functioning properly and triggers an error.
Rage click maps show all the areas that users click in frustration. (After all, wouldn’t you want to know if the most highly Rage-Clicked element on your website is the “confirm purchase” button?)
Sometimes it’s difficult to predict where users will become frustrated, which is why using your Digital Experience Intelligence solution to monitor rage clicks can be so helpful.
With Rage Click maps, you can reproduce and fix unexpected bugs to identify and correct CTA confusion to increase conversions, and increase ROI by reducing product friction.
Watch out for false positives in your Rage Click analysis, which can occur if a user is rapidly clicking through a multi-page app, for instance.
It’s always best practice to pair your Rage Click analysis with watching session replays.
Dead click heatmaps
Sometimes, users mistake un-clickable elements on a website or app as a button, and tap it expecting something to happen—resulting in a dead click. Dead clicks reveal which non-functioning elements on your site or app are being mistaken for buttons, so that you can figure out how to reduce user confusion and frustration.
They can also help understand behavioral trends over time to identify new opportunities, and proactively weed out user confusion to optimize conversions.
AI-generated heatmaps
This type of heatmap uses artificial intelligence (AI) to generate visual representations of user attention data created by software algorithms. So rather than showing what users actually are paying attention to on your website, companies like EyeQuant and Attention Insight specialize AI-generated heatmaps show what users are likely to pay attention to on your website.
Typically, AI-generated heatmaps predict future user behavior by imitating the first three to five seconds of users’ attention on a website to identify which elements are looked at most and least.
By predicting where users will look when they first navigate to a website, AI-generated heatmaps can help you understand where to place critical elements and improve future pages and sites. Additionally, they have up to 95% accuracy and are more affordable than eye-tracking technology.
However, AI-generated maps typically aren’t effective on websites with low traffic or engagement, as there are fewer actions to predict and learn from.
Why should you use a website heatmap?
Website heatmaps help you track visitor behavior visually so you can make your improve your site around your goals. They highlight which site areas people are engaging with, which areas are working, which aren’t, and which areas your users are avoiding.
These insights help you make data-driven changes — you're acting on data, not just guessing.
At many organizations, website heatmaps are part of larger conversion rate optimization (CRO) efforts, since they’re mainly used to improve conversion rates.
Website heatmaps can help you determine if:
- There is important content on a page that visitors aren’t getting to
- Users are having trouble finding or seeing certain CTAs
- Users are experiencing issues based on device type or browser
- Non-clickable elements are creating distractions that harm conversion (as shown in the video below)
Further reading: How to use session replay for conversion rate optimization
How do I create a website heatmap?
There are many tools available online. Before choosing your heatmapping tool, you’ll want to compare the tools available. You’ll need to have an idea of which page(s) on your website you want to analyze, and what type of map will surface the data you need.
You’ll also want to look for a tool provides the most types of heatmaps. You don’t solely want scroll maps or click maps—ideally, you have as many of the map types listed above. This way, you can combine the insights from each to make the most well-informed decisions for your site.
Heatmap tools
Some heatmapping tools that are available:
- FullStory
- Smartlook
- EyeQuant
- Attention Insight
- Dragonfly AI
- Mouseflow
Who can benefit from using heatmaps?
Because of the variety of data that you can glean and analyze with, heatmapping software can benefit many different teams in an organization. Here’s an overview of how different departments can gain from heatmaps:
For UX designers
User experience (UX) designers are often responsible for testing on their site or app, and heatmaps can supplement their testing methods.
For example, UX designers can use them for usability testing to understand whether their content inspires users to take action, identify patterns of behavior, and determine whether your CTAs are well-placed.
Heatmaps can also be used to strengthen the insights from A/B experiments, and can be applied both to your control and the variable you’re testing. If your variable doesn’t perform as well as you expected, you’ll know why. With one of these tools in your back pocket, even “failed” tests can provide valuable learnings.
For marketers
Any digital marketer knows that the competition for customers’ attention is greater than ever, and traffic acquisition cost (TAC) is increasing. Unsurprisingly, it’s critical to get as much value from your site traffic as possible.
Using heatmaps, marketers can understand which parts of a page or an advertisement people’s eyes gravitate toward, and which parts tend to be ignored. This knowledge allows you to place the most important element—like a special offer or a CTA button—on the most-seen part of a page.
For digital analysts
For analysts, they can provide the critical yet often-missing data that turns analysis into actionable insights and business outcomes. Using heatmaps let you combine qualitative and quantitative data in ways that add depth and context to analyses.
Where other methods may only allow you to count clicks on a button, heatmapping tools can help you understand what happened before, after, and in between those clicks—critical information for understanding your user’s behavior.
What’s more, heatmaps are highly visual by nature, allowing digital analysts to see and understand complex data sets at a glance before digging in deeper.
The pros and cons of heatmaps
Like with any type of website analytics, there are benefits and drawbacks of using heatmaps to measure user behavior. Here are a few.
Pros of heatmaps:
- See and understand large quantities of data at-a-glance in a highly visual format
- Identify areas where users might be ignoring or overlooking the action you want them to take and implement a solution
- Gain a clearer understanding of user behavior over time and identify useful patterns
- Learn from pages on your site to build more effective pages in the future
- Find out what areas of your site users are naturally drawn to and put your most important content there
Cons of heatmaps:
- Variations in device sizes and browsers can sometimes make heatmap data unreliable
A heatmap tool that doesn't account for dynamic pages or elements.
- Heatmaps often don’t work well with dynamic applications where the page changes, and most websites today are dynamic
- Without corresponding quantitative or qualitative data, they can be difficult to convert into actionable business intelligence
- Certain types of heatmaps, like eye-trackers, can be cost-prohibitive
- Some types of heatmaps, like AI-generated heatmaps, need large volumes of traffic to analyze in order to create accurate predictions
- The last problem with heatmaps is they should always be paired with other data, as any one heatmap will not provide a holistic view of why users behave the way they are.